Archive | Boulot

SIEM (cheat sheet)

In the field of computer security, security information and event management (SIEM) software products and services combine security information management (SIM) and security event management (SEM). They provide real-time analysis of security alerts generated by applications and network hardware.

Vendors sell SIEM as on-premise software or appliances but also as managed services, or cloud-based instances; these products are also used to log security data and generate reports for compliance purposes.[1]

Overview

The acronyms SEM, SIM and SIEM have been sometimes used interchangeably.[2]

The segment of security management that deals with real-time monitoring, correlation of events, notifications and console views is known as security event management (SEM).

The second area provides long-term storage as well as analysis, manipulation and reporting of log data and security records of the type collated by SEM software, and is known as security information management (SIM).[3]

As with many meanings and definitions of capabilities, evolving requirements continually shape derivatives of SIEM product-categories. Organizations are turning to big data platforms, such as Apache Hadoop, to complement SIEM capabilities by extending data storage capacity and analytic flexibility.[4][5]

Advanced SIEMs have evolved to include user and entity behavior analytics (UEBA) and security orchestration and automated response (SOAR).

The term security information event management (SIEM), coined by Mark Nicolett and Amrit Williams of Gartner in 2005 describes,[6]

  • the product capabilities of gathering, analyzing and presenting information from network and security devices
  • identity and access-management applications
  • vulnerability management and policy-compliance tools
  • operating-system, database and application logs
  • external threat data

A key focus is to monitor and help manage user and service privileges, directory services and other system-configuration changes; as well as providing log auditing and review and incident response.[3]

Capabilities/Components

  • Data aggregation: Log management aggregates data from many sources, including network, security, servers, databases, applications, providing the ability to consolidate monitored data to help avoid missing crucial events.
  • Correlation: looks for common attributes, and links events together into meaningful bundles. This technology provides the ability to perform a variety of correlation techniques to integrate different sources, in order to turn data into useful information. Correlation is typically a function of the Security Event Management portion of a full SIEM solution[7]
  • Alerting: the automated analysis of correlated events and production of alerts, to notify recipients of immediate issues. Alerting can be to a dashboard, or sent via third party channels such as email.
  • Dashboards: Tools can take event data and turn it into informational charts to assist in seeing patterns, or identifying activity that is not forming a standard pattern.[8]
  • Compliance: Applications can be employed to automate the gathering of compliance data, producing reports that adapt to existing security, governance and auditing processes.[9]
  • Retention: employing long-term storage of historical data to facilitate correlation of data over time, and to provide the retention necessary for compliance requirements. Long term log data retention is critical in forensic investigations as it is unlikely that discovery of a network breach will be at the time of the breach occurring.[10]
  • Forensic analysis: The ability to search across logs on different nodes and time periods based on specific criteria. This mitigates having to aggregate log information in your head or having to search through thousands and thousands of logs.[9]

Usage cases

Computer security researcher Chris Kubecka at the hacking conference 28C3 Chaos Communication Congress successful SIEM use cases.[11]

  • SIEM visibility and anomaly detection could help detect Zero-day (computing) or Computer_virus#Polymorphic_code. Primarily due to low rates of anti-virus detection rates against this type of rapidly changing type of malware.
  • Automatic parsing, log normalization and categorization can occur automatically. Regardless of the type of computer or network device as long as it can send a log.
  • Visualization with a SIEM using security events and log failures can aid in pattern detection.
  • Protocol anomalies which can indicate a mis-configuration or a security issue can be identified with a SIEM using pattern detection, alerting, baseline and dashboards.
  • SIEMS can detect covert, malicious communications and encrypted channels.
  • Cyberwarfare can be detected by SIEMs with accuracy, discovering both attackers and victims.

Today, most SIEM systems work by deploying multiple collection agents in a hierarchical manner to gather security-related events from end-user devices, servers, network equipment, as well as specialized security equipment like firewalls, antivirus or intrusion prevention systems. The collectors forward events to a centralized management console where security analysts sift through the noise, connecting the dots and prioritizing security incidents.

In some systems, pre-processing may happen at edge collectors, with only certain events being passed through to a centralized management node. In this way, the volume of information being communicated and stored can be reduced. Although advancements in machine learning are helping systems to flag anomalies more accurately, analysts must still provide feedback, continuously educating the system about the environment.

Here are some of the most important features to review when evaluating SIEM products:

  • Integration with other controls – Can the system give commands to other enterprise security controls to prevent or stop attacks in progress?
  • Artificial intelligence – Can the system improve its own accuracy by through machine and deep learning?
  • Threat intelligence feeds – Can the system support threat intelligence feeds of the organization’s choosing or is it mandated to use a particular feed?
  • Robust compliance reporting – Does the system include built-in reports for common compliance needs and the provide the organization with the ability to customize or create new reports?
  • Forensics capabilities – Can the system capture additional information about security events by recording the headers and contents of packets of interest?

Pronunciation

The SIEM acronym is alternately pronounced SEEM or SIM (with a silent e).


Posted in Boulot0 commentaire

A lire / à écouter / à regarder

14/12/2017

France Culture : L’Invité des Matins (2ème partie) par Guillaume Erner  (24min)
Neutralité du net, hégémonie des GAFA : la démocratie prise dans la toile (2ème partie)

Avec Benjamin Bayart et Sébastien Soriano

https://www.franceculture.fr/emissions/linvite-des-matins-2eme-partie/neutralite-du-net-hegemonie-des-gafa-la-democratie-prise-dans-la-toile-2eme-partie

Podcast France Culture

Podcast France Culture

Posted in Boulot, Clic0 commentaire

Kubernetes (notes VT)


Kubernetes

Kubernetes

Kubernetes is Google’s open source system for managing Linux containers across private, public and hybrid cloud environments.

<wikipedia> Kubernetes (commonly referred to as « K8s ») is an open-source system for automating deployment, scaling and management of containerized applications that was originally designed by Google and donated to the Cloud Native Computing Foundation. It aims to provide a « platform for automating deployment, scaling, and operations of application containers across clusters of hosts ». It supports a range of container tools, including Docker.</wikipedia>

Kubernetes automates the deployment, scaling, maintenance, scheduling and operation of multiple application containers across clusters of nodes. Kubernetes contains tools for orchestration, service discovery and load balancing that can be used with Docker and Rocket containers. As needs change, a developer can move container workloads in Kubernetes to another cloud provider without changing the code.

With Kubernetes, containers run in pods. A pod is a basic unit that hosts one or multiple containers, which share resources and are located on the same physical or virtual machine. For each pod, Kubernetes finds a machine with enough compute capacity and launches the associated containers. A node agent, called a Kubelet, manages pods, their containers and their images. Kubelets also automatically restart a container if it fails.

Other core components of Kubernetes include:

  • Master: Runs the Kubernetes API and controls the cluster.
  • Label: A key/value pair used for service discovery. A label tags the containers and links them together into groups.
  • Replication Controller: Ensures that the requested numbers of pods are running to user’s specifications. This is what scales containers horizontally, ensuring there are more or fewer containers to meet the overall application’s computing needs.
  • Service: An automatically configured load balancer and integrator that runs across the cluster.

Containerization is an approach to virtualization in which the virtualization layer runs as an application on top of a common, shared operating system. As an alternative, containers can also run on an OS that’s installed into a conventional virtual machine running on a hypervisor.

Containers are portable across different on-premises and cloud platforms, making them suitable for applications that need to run across various computing environments.

Kubernetes is mainly used by application developers and IT system administrators. A comparable tool to Kubernetes is Docker Swarm, which offers native clustering capabilities.

Posted in Boulot0 commentaire

How do I configure a Splunk Forwarder on Linux?


From Splunk Command Line Reference:

http://docs.splunk.com/Documentation/Splunk/latest/Admin/AccessandusetheCLIonaremoteserver

Note: the CLI may ask you to authenticate – it’s asking for the LOCAL credentials, so if you haven’t changed the admin password on the forwarder, you should use admin/changeme

Steps for Installing/Configuring Linux forwarders:

Step 1: Download Splunk Universal Forwarder: http://www.splunk.com/download/universalforwarder (64bit package if applicable!). You will have to create an account to download any piece of Splunk software

Step 2: Install Forwarder

tar -xvf splunkforwarder-6.6.3-e21ee54bc796-Linux-x86_64.tgz -C /opt

It will install the splunk code in /opt/splunforwarder directory

Step 3: Enable boot-start/init script:

/opt/splunkforwarder/bin/splunk enable boot-start

(start splunk: /opt/splunkforwarder/splunk start)

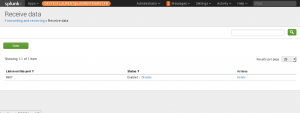
Step 4: Enable Receiving input on the Index Server

Configure the Splunk Index Server to receive data, either in the manager:

  • using the web GUI : Manager -> sending and receiving -> configure receiving -> new
  • using the CLI: /opt/splunk/bin/splunk enable listen 9997
Enable receiving on Iddexer

Enable receiving on Iddexer

Where 9997 (default) is the receiving port for Splunk Forwarder connections

Step 5: Configure Forwarder connection to Index Server:

/opt/splunkforwarder/bin/splunk add forward-server hostname.domain:9997

(where hostname.domain is the fully qualified address or IP of the index server (like indexer.splunk.com), and 9997 is the receiving port you create on the Indexer

Step 6: Test Forwarder connection:

/opt/splunkforwarder/bin/splunk list forward-server

Step 7: Add Data:

/opt/splunkforwarder/bin/splunk add monitor /path/to/app/logs/ -index main -sourcetype %app%

Where

/path/to/app/logs/ is the path to application logs on the host that you want to bring into Splunk,
%app% is the name you want to associate with that type of data

This will create a file: inputs.conf in /opt/splunkforwarder/etc/apps/search/local/

— here is some documentation on inputs.conf: http://docs.splunk.com/Documentation/Splunk/latest/admin/Inputsconf

Note: System logs in /var/log/ are covered in the configuration part of Step 7. If you have application logs in /var/log/*/

Step 8 (Optional): Install and Configure UNIX app on Indexer and nix forwarders:

On the Splunk Indexer, go to Apps -> Manage Apps -> Find more Apps Online -> Search for ‘Splunk App for Unix and Linux’ -> Install the « Splunk App for Unix and Linux’ Restart Splunk if prompted, Open UNIX app -> Configure

Once you’ve configured the UNIX app on the server, you’ll want to install the related Add-on: « Splunk Add-on for Unix and Linux » on the Universal Forwarder.

Go to http://apps.splunk.com/ and find the « Splunk Add-on for Unix and Linux » (Note you want the ADD-ON, not the APP – there is a big difference!).

Copy the contents of the Add-On zip file to the Universal Forwarder, in: /opt/splunkforwarder/etc/apps/.

If done correctly, you will have the directory « /opt/splunkforwarder/etc/apps/Splunk_TA_nix » and inside it will be a few directories along with a README & license files.

Restart the Splunk forwarder (/opt/splunkforwarder/bin/splunk restart)

Note: The data collected by the unix app is by default placed into a separate index called ‘os’ so it will not be searchable within splunk unless you either go through the UNIX app, or include the following in your search query: “index=os” or “index=os OR index=main” (don’t paste doublequotes).

You also will have to install sysstat if you want to monitor your server resources.

Step 9 (Optional): Customize UNIX app configuration on forwarders:

Look at inputs.conf in /opt/splunkforwarder/etc/apps/unix/local/ and /opt/splunkforwarder/etc/apps/unix/default/ The ~default/inputs. path shows what the app can do, but everything is disabled.

The ~local/inputs.conf shows what has been enabled – if you want to change polling intervals or disable certain scripts, make the changes in ~local/inputs.conf.

Step 10 (Optional): Configure File System Change Monitoring (for configuration files): http://docs.splunk.com/Documentation/Splunk/4.3.2/Data/Monitorchangestoyourfilesystem


Note that Splunk also has a centralized configuration management server called Deployment Server. This can be used to define server classes and push out specific apps and configurations to those classes. So you may want to have your production servers class have the unix app configured to execute those scripts listed in ~local/inputs at the default values, but maybe your QA servers only need a few of the full stack, and at longer polling intervals.

Using Deployment Server, you can configure these classes, configure the app once centrally, and push the appropriate app/configuration to the right systems.

Enjoy !

Need Help troubleshooting ?

Do the same on Microsoft Windows Platform : click, click, click …

Splunk official how-to on that part: http://docs.splunk.com/Documentation/Splunk/6.2.3/Data/Useforwardingagentstogetdata

Posted in Boulot, Splunk0 commentaire

Eclipse

Reçu dans une feuille de choux numériques ces derniers jours (WhatIs@lists.techtarget.com) j’ai trouvé le contenu ci-dessous intéressant (histoire et perspectives de la plateforme). Je me permets donc de le reproduire (sans aucune autorisation).

eclipse

eclipse

Eclipse is a free, Java-based development platform known for its plug-ins that allow developers to develop and test code written in other programming languages. Eclipse is released under terms of the Eclipse Public License.

Eclipse got its start in 2001 when IBM donated three million lines of code from its Java tools to develop an open source integrated development environment (IDE). The IDE was initially overseen by a consortium of software vendors seeking to create and foster a new community that would complement Apache’s open source community. Rumor has it that the platform’s name was derived from a secondary goal, which was to eclipse Microsoft’s popular IDE, Visual Studio.

Today, Eclipse is managed by the Eclipse Foundation, a not-for-profit corporation whose strategic members include CA Technologies, IBM, Oracle and SAP. The foundation, which was created in 2004, supports Eclipse projects with a well-defined development process that values quality, application programming interface (API) stability and consistent release schedules. The foundation provides infrastructure and intellectual property (IP) management services to the Eclipse community and helps community members market and promote commercial software products that are based on Eclipse.

In 2016, Microsoft announced it would join the Eclipse Foundation and support the integration of Visual Studio by giving Eclipse developers full access to Visual Studio Team services. Oracle donated the Hudson continuous integration server it inherited from Sun Microsystems to Eclipse in 2011 and is expected to donate the Java 2 Platform, Enterprise Edition (Java EE) to Eclipse in the near future.

Site officiel : https://www.eclipse.org/home/index.php
Wikipedia : https://fr.wikipedia.org/wiki/Eclipse_(projet)

Posted in Boulot0 commentaire

Playing with Splunk and REST API

SPLUNK and REST API

SPLUNK and REST API

How to Stream Twitter into Splunk in 10 Simple Steps ?

January 8, 2014/in Splunk /by Discovered Intelligence

My Original Tweet

My Original Tweet

Many people talk about the need to index tweets from twitter into Splunk, that I figured I would write a post to explain just how easy it is.

Within 10 steps and a few minutes, you will be streaming real-time tweets into Splunk, with the fields all extracted and the twitter data fully searchable.

Assumptions

  1. Splunk is installed and running. If you don’t have Splunk, you can download it from http://splunk.com/download
  2. Splunk will run fine on your laptop for this exercise.
  3. You have a working Twitter account

The 10 Steps

1. Go to https://dev.twitter.com/ and log in with your twitter credentials

2. At the top right, click on “My applications”

3. Click on the “Create New App” button and complete the box for Name, Description and Website. You don’t need a callback URL for this exercise. Once you have completed these three fields, click on the “Create Your Twitter Application” button at the bottom of the screen.

4. Your application is now completed and we now need to generate the OAuth keys. You should see a series of tabs on the screen – click on the ‘API Keys’ tab. At the bottom of the screen when in the API Keys tab, click on the “Create my access token” button.

5. Wait about 30 seconds or so then click on the ‘Test OAuth‘ button at the top right of the screen. You should see all fields completed with cryptic codes. If you don’t, hit back, then click the ‘Test OAuth’ button again after another 30 seconds or so. Keep this page handy – we will need it in a couple of minutes.

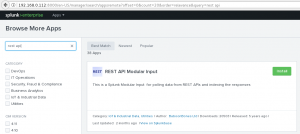
6. Ok, now log into your Splunk environment search head, where we are going to install the free REST Api modular input application. Copy the following URL and replace mysplunkserver with whatever your splunk server name is, then click on the “Install Free” button.

Splunk REST Modular Input

Splunk REST Modular Input

https://mysplunkserver:8000/en-US/manager/search/apps/remote?q=rest+api.

If you are not using SSL/TLS, change it to http rather than https. You can alternatively install the application from the Splunk app store here: http://apps.splunk.com/app/1546/

7. Click on the button to “Restart Splunk” after installation of the app.

8. This app adds a new data input method to Splunk called REST. Once logged back into Splunk, click on “Settings” (top right) then “Data Inputs” from the Settings menu.

9.The Data Inputs screen will be displayed and you will see a new data input method called REST. Click on this link, then click on the “New” green button to bring up a new REST input configuration screen.

10. Ok, last step! We are going to complete the configuration details to get our Twitter data. I have only included the fields you need to configure and everything else can be left blank, unless you need to enter in a proxy to get out to the internet.
> REST API Input Name: Twitter (or whatever you want to call the feed)
> Endpoint URL: https://stream.twitter.com/1.1/statuses/filter.json
> HTTP Method: GET
> Authentication Type: oauth1
> OAUTH1 Client Key, Client Secret, Access Token, Access Token Secret: Complete from your Twitter Developer configuration screen in Step 5 above.
> URL Arguments: track=#bigdata,#splunk^stall_warnings=true
The above URL arguments are examples. In this case, I am selecting to bring in tweets that contain the hashtag of #bigdata and #splunk. I am using the ‘track’ streaming API parameter to do this. At this point, you should read here: https://dev.twitter.com/docs/streaming-apis/parameters#track. Also note, that if you want to track multiple keywords, these are separated by a comma. However, the REST API configuration screen expects a comma delimeter between key=value pairs. Notice that I have used a ^ delimiter instead, as I need to use commas for my track values.
> Response Type: json
> Streaming Request: Yes (ensure the box is checked)
> Request Timeout: 86400
Here we are setting the timeout to be 86400 seconds which is the number of seconds in a day. As long as you have at least one tweet come through per day, then you will be ok. If the timeout window is less than the amount of time between tweets streaming in, then the data input will timeout and not recover without re-enabling the input or I would imagine a Splunk restart.
> Delimeter: ^ (or whatever delimeter you used in the URL arguments field)
> Set Sourcetype: Manual
> Sourcetype: Tweets (or whatever sourcetype name you want)
> More Settings: Yes (check the box). Optionally provide a host name and an index you want the tweets to go into. The default index is main.Note: For reference, the above configuration is stored in etc/system/local/inputs.conf

This is what the final screen will look like. Hit the “Save” button when everything looks good.
twitter_finalstep10

Search the Tweets!

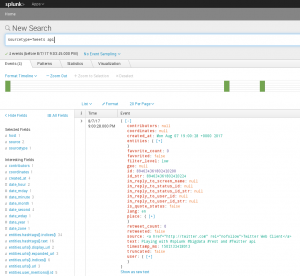
You are all done! After hitting save, the tweets should start coming in immediately. Assuming you used a sourcetype of twitter, you can now go to the search bar in Splunk and run this query:

sourcetype=twitter earliest=-1h

You should see data coming in. You will notice that Twitter includes a TON of fields with each tweet – it is quite awesome actually. All the usernames, hashtags, users in the tweets, URLs (even translated URLs) are all extracted and searchable.

Of course, the above does simplify things. You should definitely read the the Twitter API documentation properly.

Posted in Boulot, Splunk0 commentaire

Retour à ma vie de techos

Nexpose Rapid7, Ubuntu, nmap, tcpdump … j’en ai bouffé pendant 4 jours et … ça fait du bien ! Mais là faut que j’arrête ou je vais finir ingénieur réseau. Je retourne donc à Metasploit pour retrouver ce monde étrange de la sécu.

Quelle drôle d’idée d’avoir supprimé l’offre Ultimate ! Il en pense quoi HD Moore ?

Cet intermède me donne presque envie de signer une grosse mission PKI/HSM.

Mais le droit du travail est si compliqué dans notre beau pays.

4 posts (c’est autant que le nombre de mot de mon vocabulaire marocain) en 5 jours, faut croire que Casa m’inspire.

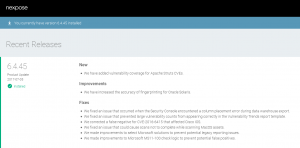
Nexpose 6.4.45

Nexpose 6.4.45

Posted in Boulot0 commentaire

Casa le vendredi soir…

عليكمالسلام

En rentrant du travail, petite halte colorée du côté de la place de Nations Unies à la descente du tram.

Ca sent le maïs grillé, les cacahuètes, les pralines, les poubelles et autres trucs inconnus. J’échange quelques dirhams contre des escargots que je mâchouille nonchalamment et dont j’évite d’imaginer le parcours. Ils sont excellents 🙂

Atmosphère de bonheur simple dans le tumulte des vendeurs de fringues et de hand spinners et autres ridicules petits coussins.

Je rejoins un attroupement autour de 4 jeunes qui poussent un petit raï bien local. J’ai presque le teint mais je ne comprends pas tout. Mais je vais progresser, promis إن شاء الله

Mélange de modernité et de bazar moyenâgeux… bienvenue à Casablanca !

[update] le Wydad Athletic Club de Casa vient de battre Zanaco en tour préliminaire de la CAF Champions League Group. Klaxons annonciateurs de fête dans les rues …

20170708_205547

Bronx marocain

Tacos & jolies petites tueuses

ici aussi c'est les soldes

Ici aussi c’est les soldes

Epis de maïs grillés

Epis de maïs grillés

Vieilles Charrues

Vieilles Charrues

La fibre arrive

Merci qui ?

Merci qui ?

Posted in Boulot, Vacances0 commentaire

Le hacking d’une brosse à dent connectée souligne la vulnérabilité de l’IoT

Après son travail sur le haccking des bracelets connectés Fitbit, la chercheuse de Fortinet s’attaque à une brosse à dents connectée.

Ingénierie inverse d'une brosse à dents connectéee

Ingénierie inverse d’une brosse à dents connectéee

L’article de base de Valéry Marchive Rédacteur en chef adjoint
Publié dans Le MagIT le 14 juin 2017 à cette adresse.

Les menaces liées aux lacunes de sécurité des objets connectés vont bien au-delà du détournement de systèmes embarqués élaborés comme des routeurs, des caméras ou même des téléviseurs. Avec des risques multiples.

L’épisode Mirai, à l’automne dernier, a peut-être contribué à éveiller les consciences sur certains risques induits par les vulnérabilités présentes dans de nombreux objets connectés. D’ailleurs, Bruce Schneier, directeur technique d’IBM Resilient, estimait récemment proche l’implication des états dans la régulation de ce marché.

Mais la menace ne touche pas uniquement ces multiples appareils relativement ouverts, souvent construits autour d’une distribution Linux dédiée, comme les routeurs, les systèmes de stockage réseau, ou encore les caméras de surveillance.

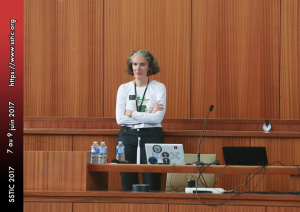
Axelle Apvrille, chercheuse en menaces chez Fortinet, le souligne : « tous les objets doivent être sécurisés, quels qu’ils soient ». Et pour illustrer son propos, elle a présenté ses travaux, lors du Sstic, la semaine dernière, à Rennes, sur une… brosse à dents connectée. Pourquoi ? Parce si l’impératif de sécurisation est « un fait que la plupart des ingénieurs et chercheurs en sécurité ressentent intuitivement, ce n’est pas le cas des développeurs d’objets connectés, concepteurs ou hommes d’affaires ».

La brosse à dents question est celle livrée par l’assureur dentaire américain Beam à ses clients, qui communique avec une application pour smartphone via Bluetooth. Celle-ci « permet de vérifier à quel point vous vous brossez bien les dents ».

Mais voilà, il est possible d’altérer tant le fonctionnement de l’appareil que les données transmises à l’application et, par suite, à l’assureur… en faisant se passer un autre équipement Bluetooth pour une brosse à dents. Lequel interagit dès lors avec l’application mobile. Et cela en raison de l’absence de mécanismes d’authentification, ou de chiffrement des échanges, sauf pour une donnée relative au brossage, chiffrée en AES ECB avec clé « en dur dans le code, facilement récupérable ».

Pour arriver à ces trouvailles, Axelle Apvrille s’est penchée, d’une part, sur l’application mobile, avec un outil de désassemblage, et d’autre part, sur la capture des paquets Bluetooth, afin d’étudier les échanges entre brosse à dents et application. La chercheuse s’est également intéressée aux API du service en ligne de Beam. Pour y trouver, là encore, des vulnérabilités.

L’ensemble fait en définitive courir à l’assureur le risque de recevoir des informations falsifiées sur les performances de ses clients. Lesquels sont censés payer une prime d’assurance plus basse lorsqu’ils se brossent mieux les dents. A ce risque de fraude, s’en ajoutent d’autres, d’atteinte à la vie privée, notamment du fait de l’absence de randomisation de l’adresse MAC de l’interface Bluetooth de la brosse, et parce qu’elle émet en continu, mais également d’accès à des données personnelles.

Axelle Apvrille s’est rapprochée de l’assureur américain. Mais sa première notification a été appréhendée comme… un pourriel. Et son adresse e-mail s’est retrouvée placée en liste noire. C’est via le service commercial de Beam qu’elle est finalement parvenue à dialoguer avec l’assureur. Mais son compte de test a été fermé à l’issue de la notification des vulnérabilités découvertes dans les API utilisées pour les échanges avec l’application.

La vidéo / démonstration au SSTIC 2017 est ici.

SSTIC 2017

SSTIC 2017

Posted in Boulot, Hack0 commentaire

General Data Protection Regulation in a few words

Raccourci synthétique du Réglement Général pour la Protection des données, volé ici.

General Data Protection Regulation (GDPR) is a directive that will update and unify data privacy laws across in the European Union. GDPR was approved by the EU Parliament on April 14, 2016 and goes into effect on May 25, 2018.

GDPR replaces the EU Data Protection Directive of 1995. The new directive focuses on keeping businesses more transparent and expanding the privacy rights of data subjects. Mandates in the General Data Protection Regulation apply to all data produced by EU citizens, whether or not the company collecting the data in question is located within the EU, as well as all people whose data is stored within the EU, whether or not they are actually EU citizens.

Under GDPR, companies may not store or use any person’s personally identifiable information without express consent from that person. When a data breach has been detected, the company is required by the General Data Protection Regulation to notify all affected people and the supervising authority within 72 hours.

In addition, companies that conduct data processing or monitor data subjects on a large scale must appoint a data protection officer (DPO). The DPO is responsible for ensuring the company complies with GDRP. If a company does not comply with the GDPR when it becomes effective, legal consequences can include fines of up to 20 million euros or 4 percent of annual global turnover.

Under the General Data Protection Regulation, data subject rights include:

Right to be forgotten – data subjects can request personally identifiable data to be erased from a company’s storage.
Right of access – data subjects can review the data that an organization has stored about them.
Right to object – data subjects can refuse permission for a company to use or process the subject’s personal data.
Right to rectification – data subjects can expect inaccurate personal information to be corrected.
Right of portability – data subjects can access the personal data that a company has about them and transfer it.
Some critics have expressed concern about the United Kingdom’s upcoming withdrawal from the EU and wonder whether this will affect the country’s compliance with the GDPR. However, because companies in the U.K. often do business with customers or other organizations in EU member states, it is expected that businesses in the U.K. will still need to comply with the General Data Protection Regulation.

I would just add the following point about GDPR : Mapping all processing activities (in fact it goes far beyond data mapping, as it refers to processing operations themselves, not only to the data being processed, it also refers to cataloging the purposes of the processing operations and identifying all sub-contractors relevant for the processing operations);

Tableau CNIL de registre des traitements (registre-reglement-publie)
Trame CNIL de notification de violation de données à caractère personnel (CNIL_Formulaire_Notification_de_Violations)

Posted in Boulot, CyberDefense0 commentaire